The Bay Area and other places with high housing costs see the strongest small business job growth
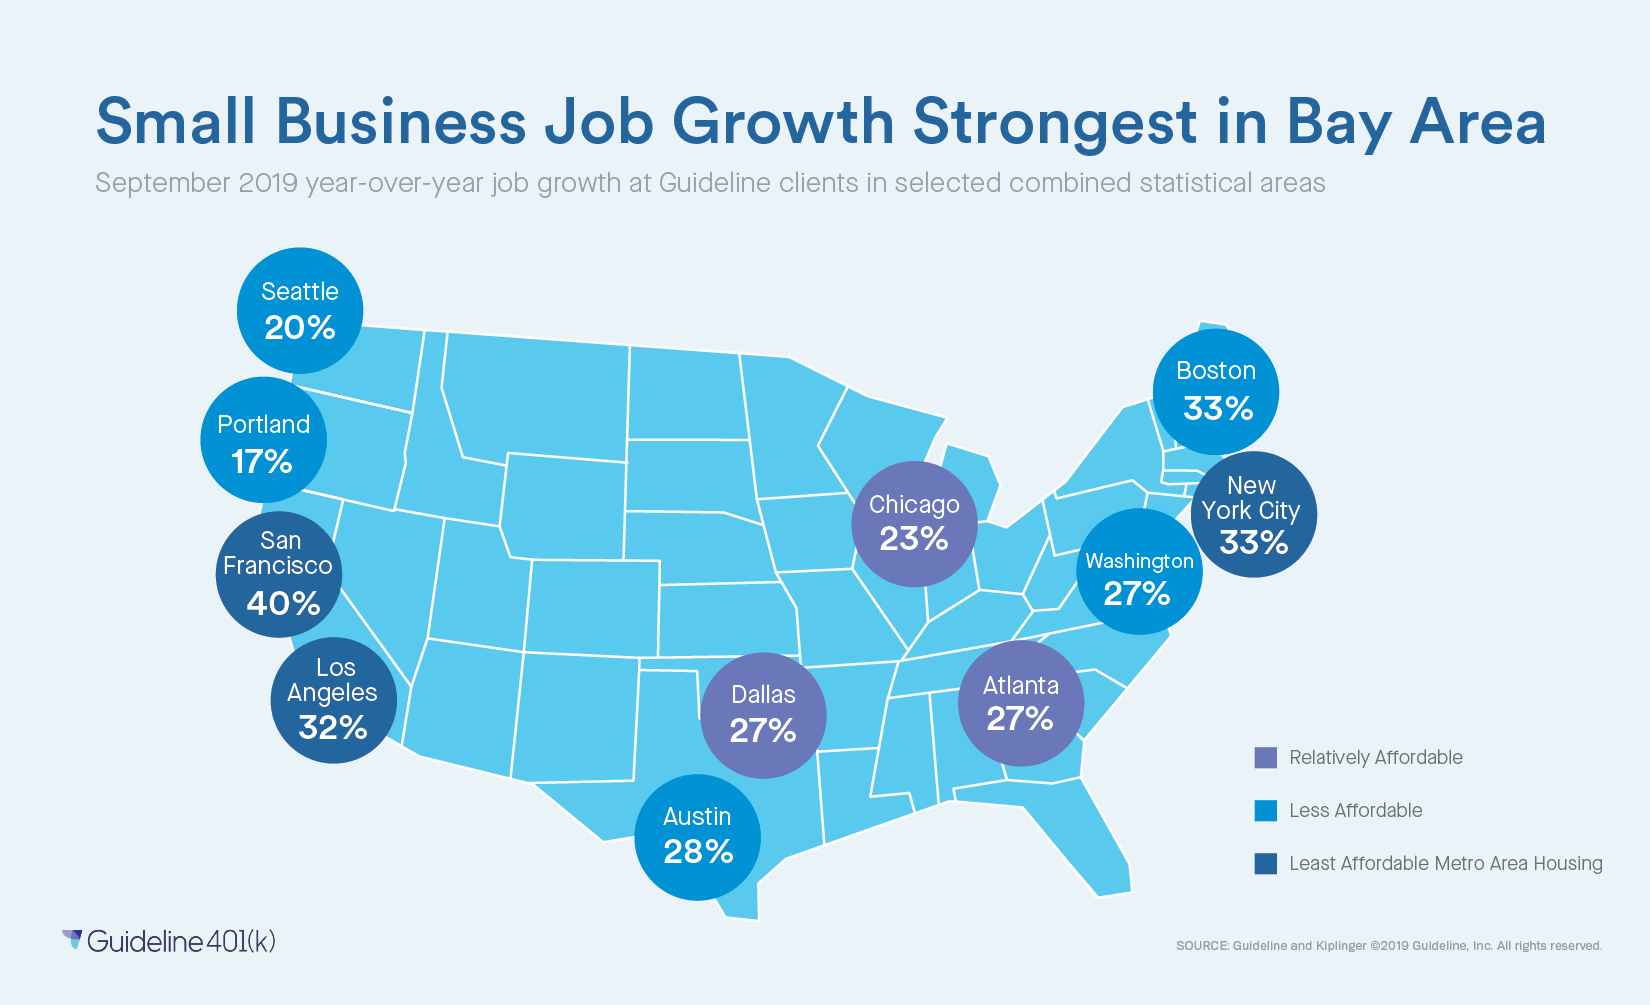
The San Francisco Bay Area, New York, Boston, and Los Angeles, four places with sky-high housing costs, also saw the strongest small business job growth over the past year, according to our analysis at Guideline.
In the Bay Area, companies that offer their employees a Guideline 401(k) added 40% more jobs overall from September 1, 2018 to September 1, 2019. Including commuter communities, New York and Boston each added 33%, and Los Angeles added 32%.
In contrast, Atlanta, Chicago, and Dallas, three cities with much more affordable housing, showed lower, but still very robust job growth, ranging from 26 to 34%. Among the combined statistical areas we considered, Portland and Seattle showed the lowest job growth over the past twelve months, at 19 and 20%.
Small business job growth strongest in Bay Area
Across all of these regions, the rate of job growth at companies that use Guideline is still very strong in comparison with small businesses across the U.S. as a whole, with recent data from ADP suggesting that the overall year-over-year gain in jobs as of mid-August 2019 in private-sector companies with up to 499 employees was 1.5%.

In our analysis, we used Kiplinger’s Housing Affordability Index, which ranks San Francisco, New York, and Los Angeles at 10/10, making them among the least affordable regions in the nation. Boston, Austin, Washington, Seattle, and Portland were close behind at 9/10; and Atlanta, Chicago, and Dallas all scored much lower, from 4/10 to 5/10.
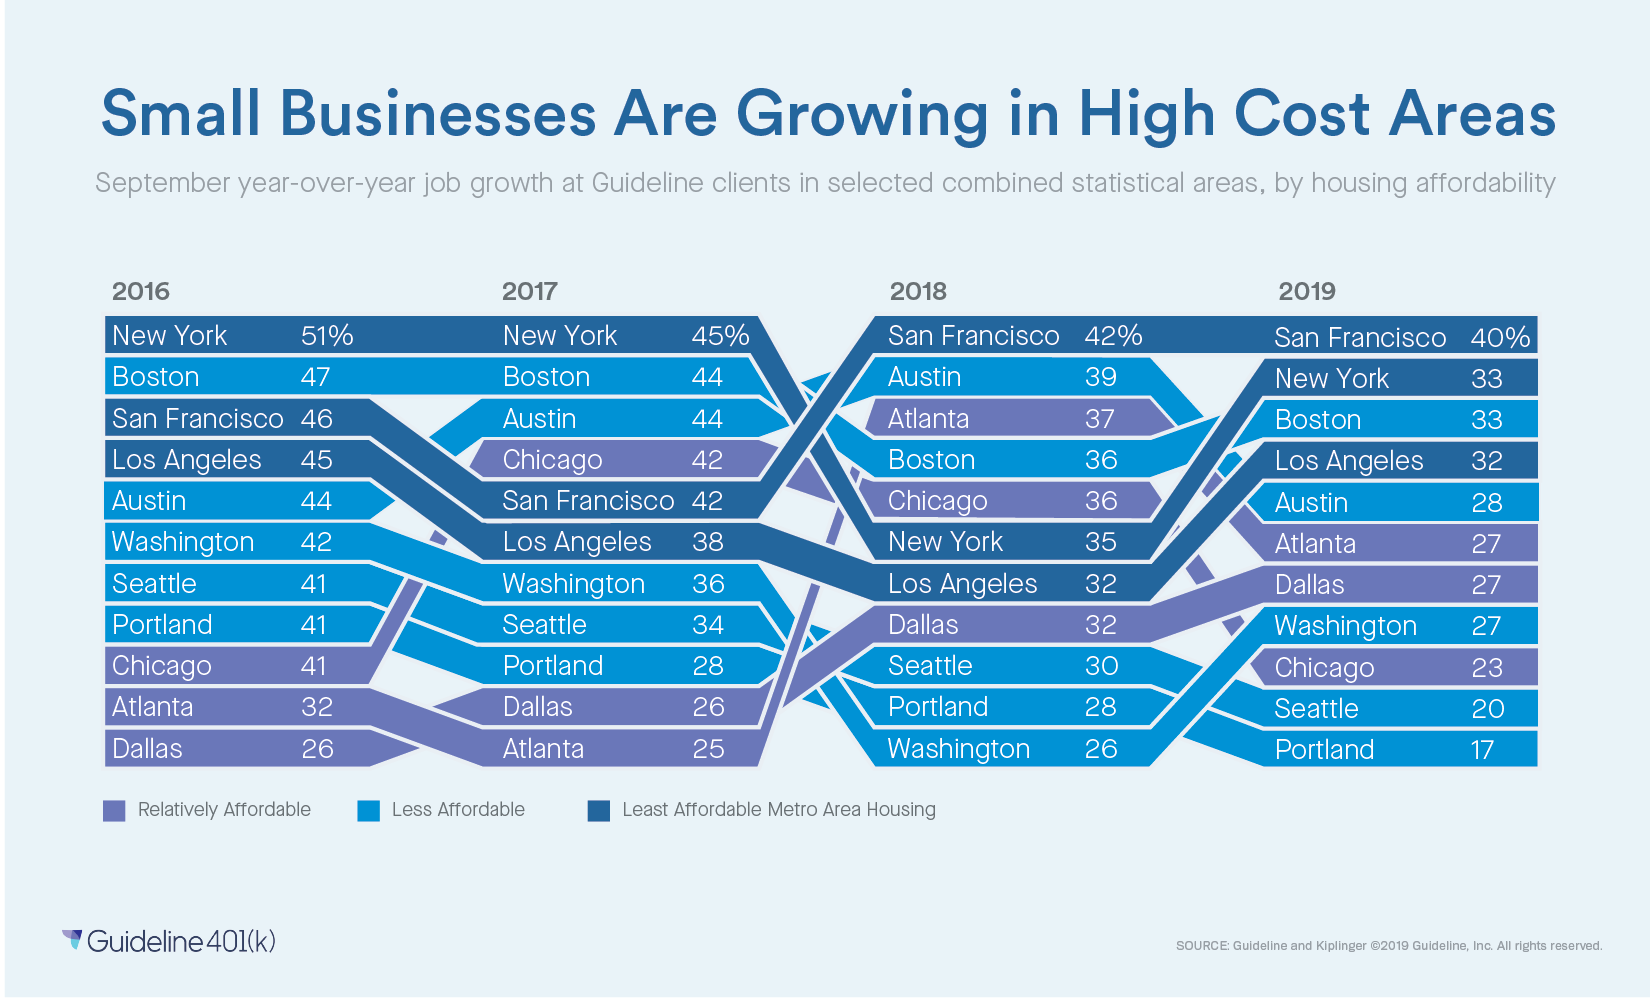
Significantly more affordable than the other regions on this list, these three non-coastal locations have been making gains in small business job growth over the past three years. Whereas Dallas, Atlanta, and Chicago had the lowest job growth in the twelve months leading up to September 1, 2016, they have ranked higher in the years since--at times outpacing much larger, more expensive markets.
Small businesses are growing in high cost areas

Job growth and housing affordability are often discussed together in terms of both macroeconomics and the life choices of individuals.
In economic terms, an increase in available jobs encourages people to move to or remain in an area, in turn driving demand for housing. While the law of supply and demand suggests that this would result in more housing being built, this has not happened in places such as New York and the Bay Area, resulting in relentless increases in housing costs.
Eventually, workers and businesses may both begin to leave for lower cost areas. Economists fret over whether and to what extent high housing costs are dampening economic growth, whether regionally or with ripple effects nationwide.
Of course, local housing costs and job markets are key factors that individuals weigh, as well, when deciding whether to stay where they are or take a chance on a much costlier (or less costly) location.
Guideline
Guideline offers easy, low-cost 401(k) plans for small businesses. You can get started with Guideline, or email us at hello@guideline.com to get answers from a specialist.
Methodology: We analyzed anonymized employment data from over 9,000 companies that offer Guideline 401(k) plans. Our analysis counted job gains from company expansions and job losses from company contractions, but not gains and losses due to companies being founded or going out of business, from September 1 to September 1 of each year.
Companies were sorted into combined statistical areas based on their primary zip code. Each combined statistical area includes multiple adjacent metropolitan and micropolitan areas, which are considered by the U.S. Office of Management and Budget to have strong economic interdependencies based on commuter patterns. For example, “San Francisco” here refers to the San Jose-San Francisco-Oakland, CA combined statistical area which encompasses 14 counties in the San Francisco Bay Area.
For housing affordability, we used Kiplinger’s Housing Affordability Index from January 2019, with a score of 10/10 being “least affordable,” 9/10” being “less affordable,” and lower scores (4-5/10 for our selection of metropolitan areas) being “relatively affordable.”
Media requests, questions, and comments about this data can be sent to data.research@guideline.com.


